
How to create Charts in Word 2013
1. Open a Word document
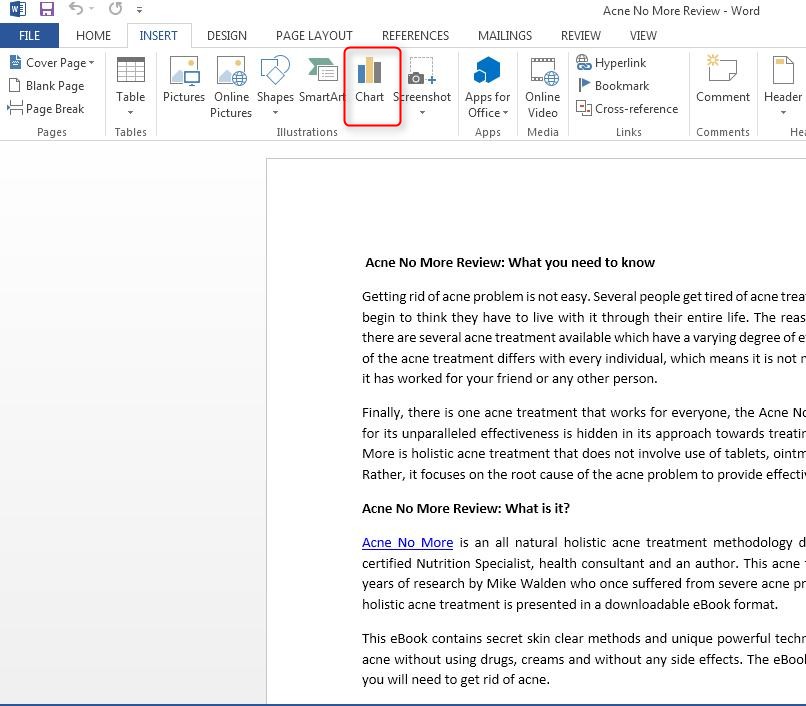
2. Click on Insert
3. Locate Chart and click on it.
A dialog box opens which lists different types of Charts and Graphs that can be created
4. Select the type of Chart you want to create.
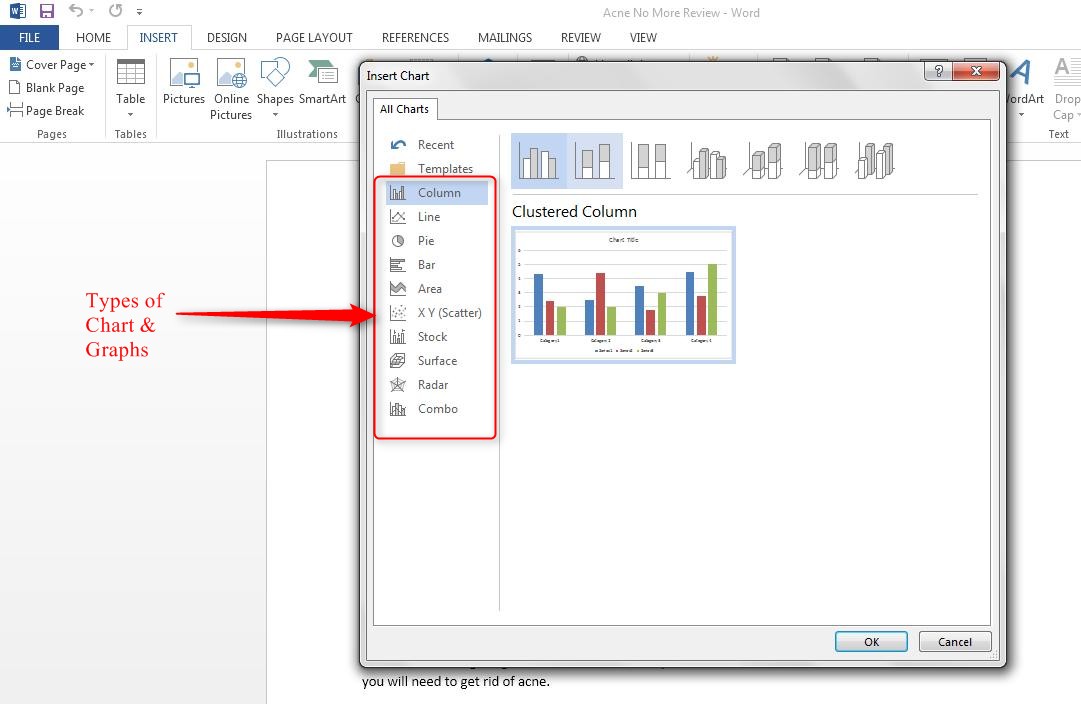
5. Click on OK to confirm your selection
A sample Excel worksheet opens which lists some variables. A Chart is also inserted in your Word document. The Chart that is inserted in your document is created by using variables in the sample Excel Worksheet.
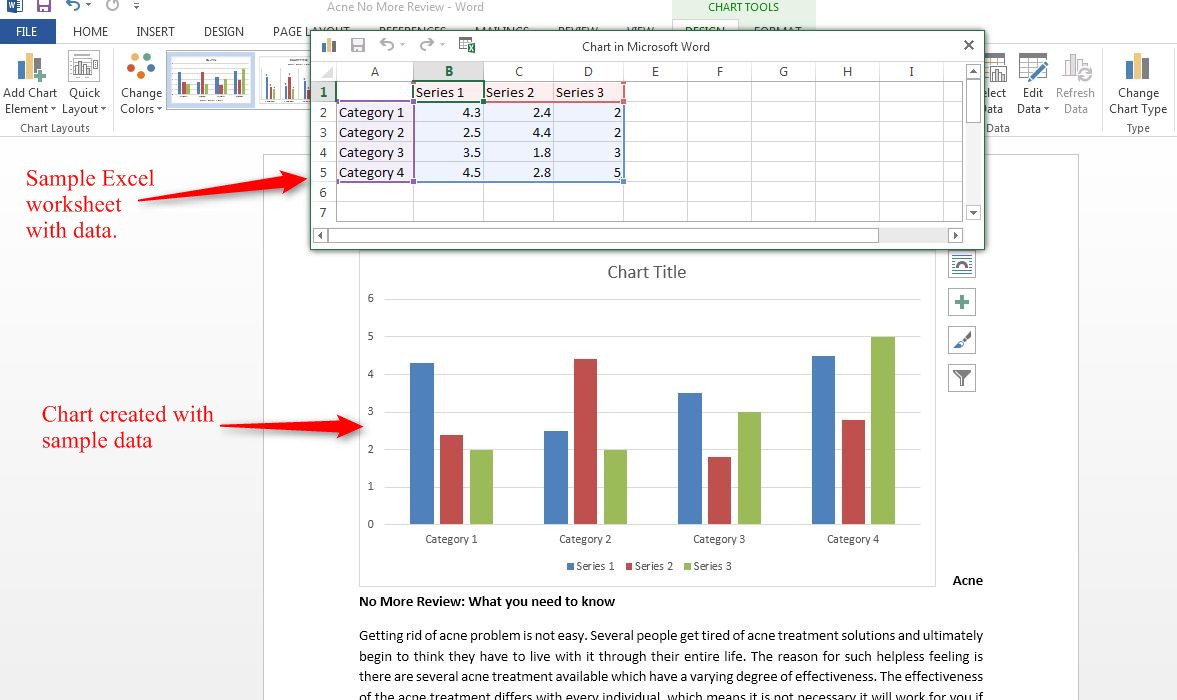
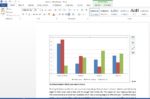
6. Enter your Chart data in the Excel Worksheet and you can see the Chart in the document changes as per the values entered in the Excel Worksheet.
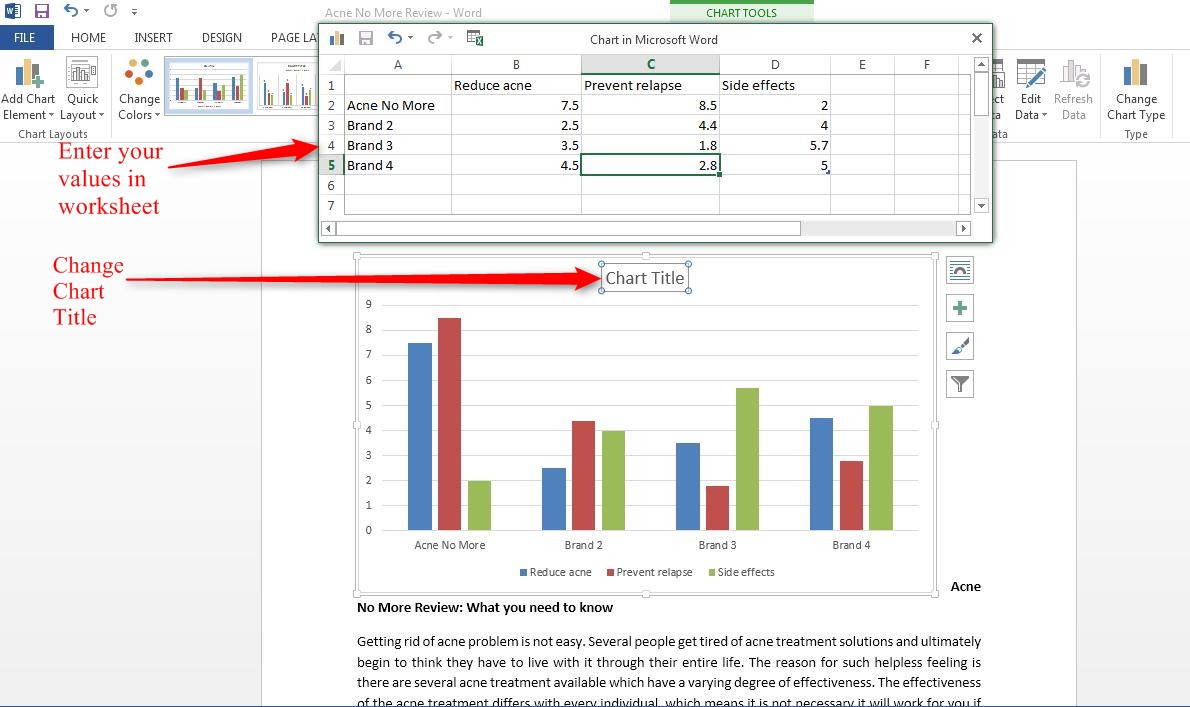
7. Close the Excel Worksheet after you entering the data.
(Note: Whenever you want to change the Chart data, right click on the Chart and select “Edit data”)
8. Click on Chart Title and enter appropriate name
9. To change the type of Chart, click on Change Chart Type option located in the top right corner of the Ribbon. Alternatively, you can also right click on Chart and select Change Chart Type option listed in the menu.
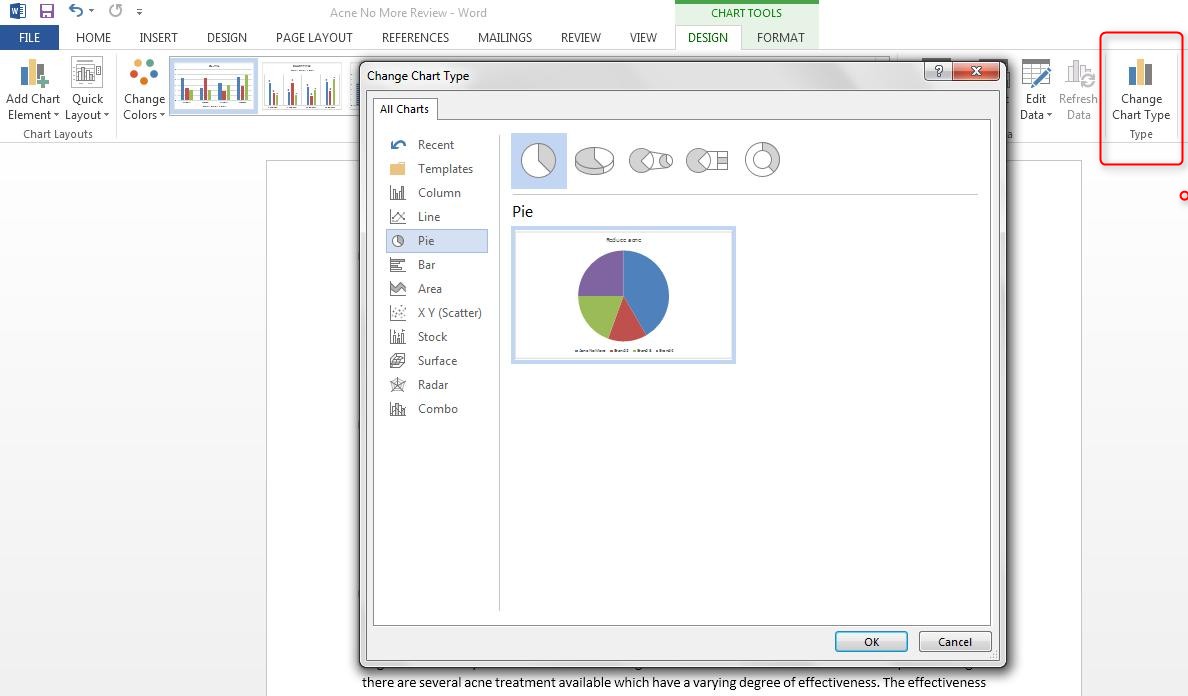
10. Select the Chart Type from the dialog box
11. Click OK.